Using QwtPlotSpectroCurve
Using QwtPlotSpectroCurve (first familiarize yourself with QwtPlotCurve here) you can display information that requires representation in three dimensions; create pseudo 3D graphs on a two-dimensional plane. The third dimension will be conveyed through color gradients - these graphs are called spectrograms. Unlike the QwtPlotSpectrogram component, you control each point on the curve, rather than intervals. The QwtPlotSpectroCurve component is less functional but more logical for graph plotting.
Let's consider a simple example. Let's plot a circle where the third dimension depends on the radius - a funnel in the center, and higher values around the edges proportionally to the radius.
#include <qwt_plot.h>
#include <qwt_plot_spectrocurve.h>
#include <QVector>
#include <qwt_point_3d.h>
#include <qwt_color_map.h>
....double pi = 3.14;
double dr = 0.025;
double d_angl = 0.0025;
double r_max = 5;
//Create an instance of a vector and a curve
QVector<QwtPoint3D> *vector = new QVector<QwtPoint3D>;
QwtPlotSpectroCurve *curve = new QwtPlotSpectroCurve;
//A color map is necessary to set the colors of the maximum
//and minimum values, as well as to control additional settings.
//ColorMap is a descendant of QwtLinearColorMap. You can't
//just create an instance of the latter - it's abstract.
//ColorMap description is below
ColorMap *colormap = new ColorMap;
//Connect the curve to the plot
curve->attach(ui->qwtPlot);
//Set the color map for the curve
curve->setColorMap(colormap);
//Specify which values are the minimum and maximum
curve->setColorRange(QwtInterval(0, r_max));
//Use two loops for iteration. The outer one goes through
//the radii, thus drawing rings with an incremented radius
//of dr. The inner one iterates over the ring
//(polar coordinate system principle).
for(double r = dr; r < r_max; r += dr) {
 for(double angl = 0; angl < 2*pi; angl += d_angl) {
  vector->append(QwtPoint3D(r*sin(angl), r*cos(angl), r));
 }
}
//Connect points to the curve
curve->setSamples(*vector);
//Redraw the plot to display the changes
ui->qwtPlot->replot();
#include<qwt_color_map.h>//Since QwtLinearColorMap is abstract, we can't
//create instances of it directly. We need to describe
//a descendant first. Let's limit ourselves to colors
//for the minimum and maximum values
class ColorMap: public QwtLinearColorMap
 {
public:
 ColorMap(): QwtLinearColorMap(Qt::darkBlue, Qt::darkRed)
  {
  }
 };
addColorStop(double range, QColor color);addColorStop(0.3,Qt::green);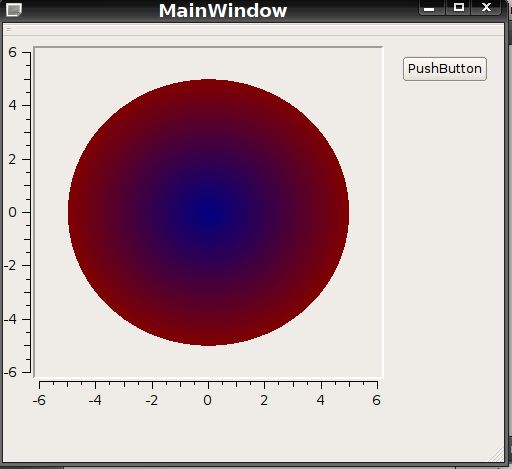
Download the complete example: qwtspectro
The example is written for Linux, so if you are using Windows (or another Linux distribution), you will need to adjust the *pro file - specify the location of the qwt library.