Usage of QwtPlotSpectrogram
Previously, we learned to use the QwtPlotSpectrocurve component (here). Qwt provides an alternative component that is more convenient for visualizing analytical functions. In this note, we will learn how to use QwtPlotSpectrogram.
QwtPlotSpectrogram accepts data in the form of an object, which is a subclass of QwtRasterData. QwtRasterData is an abstract class, so we will first create a subclass:
#include <qwt_raster_data.h>
...class RasterData: public QwtRasterData
{
public:
RasterData()
{
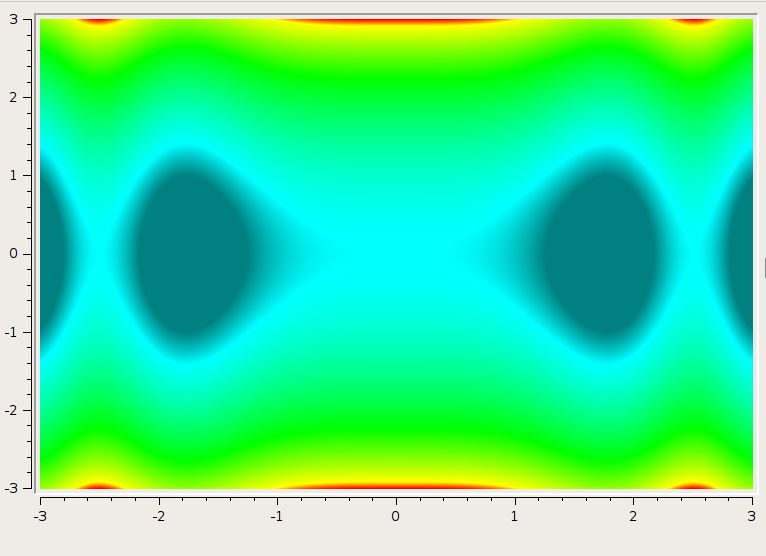
setInterval( Qt::XAxis, QwtInterval( -3.0, 3.0 ) );
setInterval( Qt::YAxis, QwtInterval( -3.0, 3.0 ) );
setInterval( Qt::ZAxis, QwtInterval( 0.0, 10.0 ) );
}
virtual double value( double x, double y ) const
{
return ( cos(x*x) + y*y);
}
};
value( double x, double y ) method returns the function z(x, y). The example uses an analytical function, but you can use other methods to define a set of values.Next, just like in the example with QwtPlotSpectrocurve, we need to set up a color map which will map the interval values to colors:
#include <qwt_color_map.h>class ColorMap: public QwtLinearColorMap
{
public:
    ColorMap():
        QwtLinearColorMap( Qt::darkCyan, Qt::red )
    {
        addColorStop( 0.1, Qt::cyan );
        addColorStop( 0.6, Qt::green );
        addColorStop( 0.95, Qt::yellow );
    }
};
    QwtPlotSpectrogram *spectrogram = new QwtPlotSpectrogram;    spectrogram->setColorMap( new ColorMap() );
    spectrogram->setData(new RasterData());
    spectrogram->attach(ui->qwtPlot);
    ui->qwtPlot->replot();
 You can download the complete example here.