Building graphs (QT)
Unfortunately, in QT there is no convenient component TChart (from Borland, for Delphi/Builder). But there is a good alternative - Qwt. There should be no problems with adding graphs and histograms, but sometimes (depending on the task) there may be difficulties with bubbles. But not now. Let's start with regular graphs.
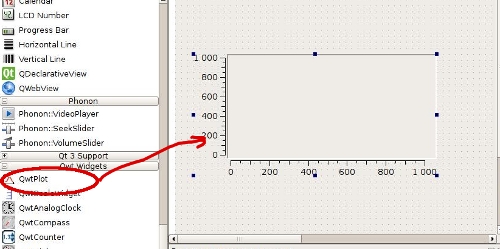
To build a graph you need:
1. Add the QwtPlot component to the form in the visual editor
2. On the QwtPlot component, you can display various curves (graphs). There are differences in creating curves between versions 5.* and 6.* of Qwt.
The class that allows you to plot curves is QwtPlotCurve. Points can be added using various methods. We will only consider some of them.
The process of plotting graphs in Qwt 5 is described in detail here: http://qtlinux.narod.ru/use_qwtplot.htm
In short, you first need to create a polygon of points and then pass it to the curve, which you should attach to the QwtPlot. Something like this:
        #include "qwt_plot_curve.h"
        ...
        QwtPlotCurve *curve = new QwtPlotCurve;
        QPolygonF* polygon = new QPolygonF;
        for (float i=0; i<=30; i += 0.01)
           polygon->append(QPointF(i, sin(i)));
        curve->setData(*polygon);
        curve->attach(ui->qwtPlot);
        ui->qwtPlot->replot();
With Qwt 6, the general idea remains the same, but instead of QPolygonF, you need to use QVector<QPointF>:
#include "qwt_plot_curve.h"
......
QwtPlotCurve *curve = new QwtPlotCurve;
QVector<QPointF>* vector = new QVector<QPointF>;
for (float i=0; i<=30; i += 0.01)
   vector->append(QPointF(i, sin(i)));
curve->setSamples(*vector);
curve->attach(ui->qwtPlot);
ui->qwtPlot->replot();
To change the color of the graph, you need to call the setPen method, for example like this:
curve->setPen(QPen(QColor(int red, int green, int blue, int brightness)));
You can also fill the graph:
curve->setBrush(QBrush(QColor(int red, int green, int blue, int brightness)));
You can also set the style of the graph (by default, the graph points are connected by lines). But there are other options:
сurve->setStyle(QwtPlotCurve::Dots); //just display points
curve->setStyle(QwtPlotCurve::Steps); //draws "steps"
curve->setStyle(QwtPlotCurve::Lines); //the default
Of course, QwtPlotCurve understands not only QPolygonF/QVector<QPointF> - you can also pass pointers to X, Y, and many other types - only basic examples are shown here.
Note: When using Qwt 6, the QwtPlotCurve object must be created dynamically - for some reason it doesn't work with a static object, although the compiler does not give any errors...